
This feature is only available in Resolver Pro.
Resolver Pro includes detailed chat analytics that help you understand how active and effective your chatbot is.
Reviewing chat activity
Visit the Analytics menu, and you’ll see stats and charts outlining your chatbot’s performance.
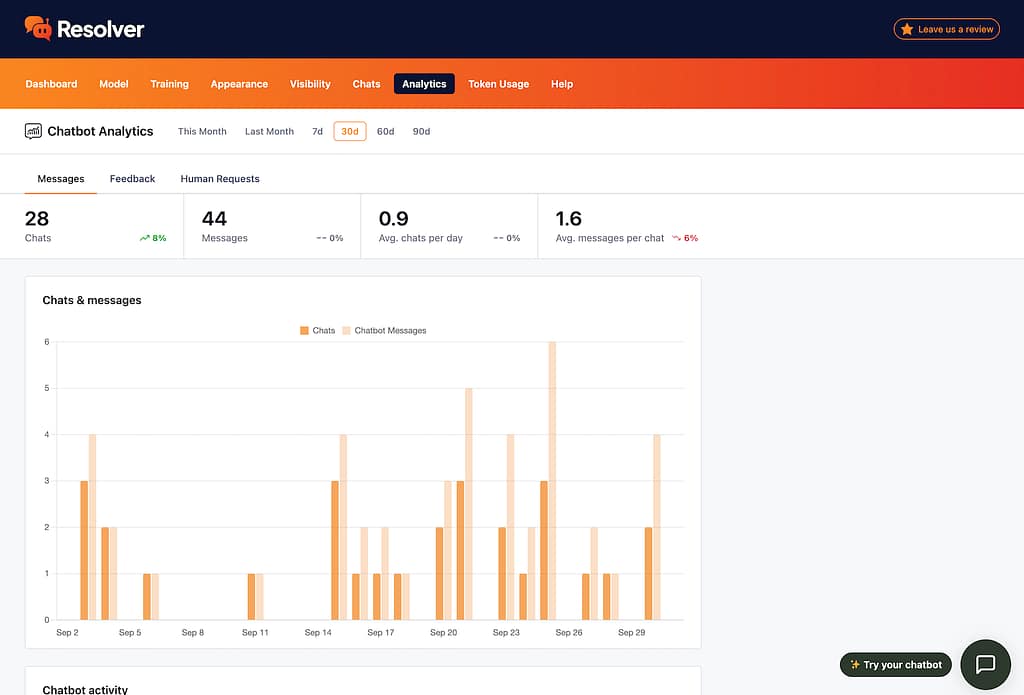
At a glance, you can get an understanding of how active your chatbot has been and how many messages it takes to close out a chat.
Using the metrics
Near the top of the page, you’ll see the following four metrics:
- Chats
- Messages
- Average chats per day
- Average messages per chat
It’s important to know that these metrics only count messages sent by your chatbot. Messages sent by visitors are not counted here.
The Chats and Messages metrics can help you understand how active your chatbot has been compared to the previous period. The chart includes these same metrics, making it easy to see the activity of your chatbot over time.
The Average Chats Per Day metric gives you a single metric to understand how much use your chatbot is getting and allows you to make a simple comparison to the previous date range.
Lastly, the Average Messages Per Chat metric is useful for understanding how quickly your chatbot is delivering a solution. Generally speaking, fewer messages are better since that means the chatbot is giving valuable replies that resolve the issue quickly.
Using the heatmap
The heatmap chart at the bottom of the report is also useful for analyzing your chatbot’s activity.
This chart shows you how many chats were created, on average, each hour of the week. The data is based on the current date range, so increasing the date range to 90 days will give you even more reliable data.
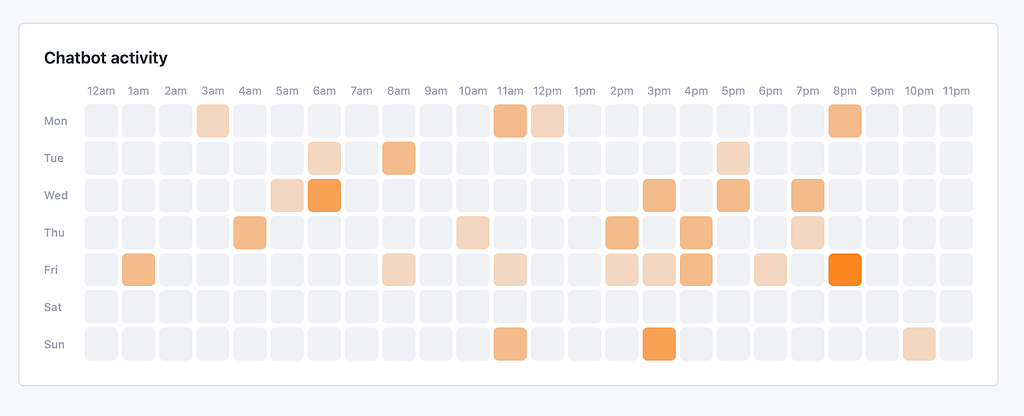
You can hover over any hour, and a tooltip will appear telling you the exact number of new chats that took place in that hour. Keep in mind that this is from a sample over the entire date range selected.